GreenHub
Low Carbon Polymers: Four Routes to a Lower-Carbon Plastic, and How to Measure Them
Low carbon polymers are plastics or compounds whose cradle-to-gate carbon footprint, in kilograms of CO₂e per kilogram of material, is measurably lower than that of the virgin fossil polymer they replace. The term has no legal definition, so a claim only holds when it states its number and its reference.
For a manufacturer, the practical questions follow from that: how many kilograms of CO₂e does a part carry today, how many could it carry with a different material, and how do you prove the difference? This guide covers where a polymer’s footprint comes from, the four routes to lower it, how to measure the result and what you can claim.
Where a polymer’s carbon footprint comes from
Most of a plastic’s cradle-to-gate footprint is set before the granules reach your machine. For a fossil polymer it comes from:
- Feedstock: extracting and refining oil or gas.
- Polymerization: the energy that turns monomers into resin.
- Compounding and transport: blending additives and fillers, then shipping the granules.
The screening values in our carbon footprint calculator, compiled from public LCA sources, show how far common materials sit from each other:
| Material | Cradle-to-gate, kg CO₂e per kg (screening, central value) |
|---|---|
| PP | 1.9 |
| HDPE | 1.9 |
| PET | 2.7 |
| ABS | 3.8 |
| PA6 | 8.0 |
| Recycled PP (rPP) | 0.9 |
| PLA | 1.6 |
| PHA (mixed family) | 2.4 (range 1.2 to 5.5) |
| PBS, about 50 % bio-based | 2.9 |
| Bio-PBS, fully bio-based | 2.3 (range 1.5 to 4.5) |
| PBAT | 3.2 |
These are indicative values, not certified data. Two points stand out. Moving from one fossil polymer to another already changes the footprint by a factor of four. And “bio-based” or “compostable” does not mean lower carbon by itself: PBAT and PBS, two common compostable polyesters, sit above virgin PP. Compostability describes the end of life; the carbon footprint depends on how the material is made.
Processing adds a smaller share. Injection molding uses roughly 0.9 kWh per kilogram of part. On the French grid (about 0.06 kg CO₂e per kWh) that adds about 0.05 kg CO₂e per kilogram; on a coal-heavy grid at 0.58 it adds about 0.5 kg, more than a quarter of virgin PP’s footprint.
Four routes to a lower-carbon polymer
1. Recycled content (PCR and PIR)
Mechanically recycled PP, PE and PET skip the feedstock and polymerization steps, which is why recycled grades screen at about half of virgin material (rPP 0.9 against PP 1.9). The limits are supply, color and odor, variation in melt flow and mechanical properties and, for food contact, approved recycling processes.
The EU Packaging and Packaging Waste Regulation (PPWR, Regulation (EU) 2025/40) sets minimum recycled content for plastic packaging from 2030, so for packaging this route is becoming an obligation.
2. Bio-based polymers
PLA made from plant sugars and PHA made by fermentation replace fossil feedstock with plant carbon. Results vary widely: PLA screens at 1.6, while PHA ranges from 1.2 to 5.5 depending on the process. PLA and PHA need their own processing windows, and PLA softens at around 55 °C, which rules it out for heat-exposed parts.
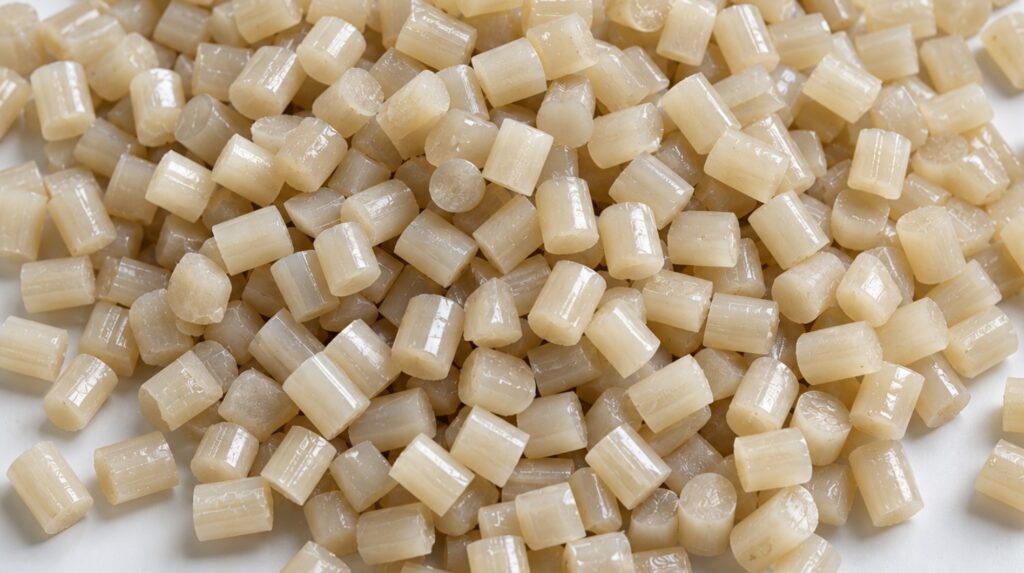
A closer look at PHA.
PHA (polyhydroxyalkanoates) is a family of polyesters that bacteria produce by fermenting sugars, plant oils or waste streams; PHB, PHBV and PHBH are the common grades. It attracts attention because it is fully bio-based and, depending on the grade, can be certified home compostable. Its carbon footprint is also the most variable of the bio-based polymers: screening values run from 1.2 to 5.5 kg CO₂e per kilogram, with a central value of 2.4, above virgin PP. Feedstock and the energy used for fermentation and extraction make the difference, and grades made from waste streams with low-carbon energy sit at the bottom of the range.
In processing, PHA has a narrow window (roughly 140 to 180 °C depending on the grade) and is sensitive to residence time. Compounding PHA with biomass lowers its footprint per kilogram, as the calculation below shows. Biomera can also develop PHA-based compounds on request, formulated for your process and your footprint target.
3. Biomass fillers and bio-based masterbatch
Agricultural and food-industry residues such as sugarcane bagasse, rice husks or coffee grounds carry a small footprint of their own: screening data put bagasse fiber at about 0.2 kg CO₂e per kilogram, within a literature range that goes up to about 0.6. The figure depends on a method choice. Some studies count bagasse at zero, treating it as a waste of sugar production; reference databases such as ecoinvent treat it as a co-product and allocate part of the sugarcane burden to it. Any LCA should state which approach it uses. Replacing part of a polymer with this biomass lowers the footprint roughly in proportion to the share replaced.
A bio-based masterbatch is the practical way to do it on parts already in production. It is a concentrate containing up to 90 % biomass that you blend into your own polymer; blended with PP, it gives a biocomposite of about 30 % biomass. In most cases it runs on your existing injection molding or extrusion equipment, with adjusted process settings.
Each route changes a different part of the footprint, and they can be combined.
A screening calculation with the values above (materials only, before compounding energy):
| Material | Calculation | Screening result |
|---|---|---|
| Virgin PP | 1.9 kg CO₂e/kg | |
| PP with 30 % bagasse | 0.7 × 1.9 + 0.3 × 0.2 | about 1.4 kg CO₂e/kg, about 27 % lower |
| Recycled PP with 30 % bagasse | 0.7 × 0.9 + 0.3 × 0.2 | about 0.7 kg CO₂e/kg, about 64 % lower |
| PHA (central value) with 30 % bagasse | 0.7 × 2.4 + 0.3 × 0.2 | about 1.7 kg CO₂e/kg, about 8 % lower than virgin PP |
| Low-footprint PHA (1.2) with 30 % bagasse | 0.7 × 1.2 + 0.3 × 0.2 | about 0.9 kg CO₂e/kg, about 53 % lower than virgin PP |
Counting the bagasse at zero, as a residue, changes little in a 30 % blend: PP with 30 % bagasse comes out at about 1.33 instead of 1.39 kg CO₂e/kg, about 30 % lower than virgin PP instead of 27 %. These are screening figures, not a product carbon footprint. For your part, the result is quantified per ISO 14067 on request, before any claim is made. In a durable part, the plant carbon held in the biomass (about 1.6 kg of CO₂ per kilogram of bagasse) stays stored for the life of the product. Compostability depends on the polymers: with a compostable binder and host polymer the blend can be compostable; in PP or PE it is not.
For a side-by-side view of the two Biomera routes, see Biocomposite vs Masterbatch; for PP and PE specifically, see our guide to decarbonizing PP and PE with bio-based masterbatch.
4. Process energy
The same part molded on a low-carbon grid carries less CO₂e. Renewable electricity contracts, efficient machines and lower scrap rates all count, and they add to every material route above.
They do not change the polymer’s own footprint, which usually remains the larger share.
Which route first? A comparison
The four routes side by side, against virgin PP and with the same screening values:
| Route | Screening effect against virgin PP (1.9) | Main constraint | Good fit |
|---|---|---|---|
| Recycled content | rPP 0.9 | Supply, property variation, food contact | Packaging, PPWR targets |
| Bio-based polymer | PLA 1.6, PHA 1.2 to 5.5 | Cost, processing window | When the polymer itself has to change |
| Biomass masterbatch | About 1.4 at 30 % bagasse | Appearance, filler level | Parts already in production |
| Process energy | Up to about 0.5 per kg on a coal-heavy grid | Site energy contracts | Every route |
The routes combine. A recycled base with a biomass masterbatch uses two levers at once, as the screening calculation above shows.
How to measure low carbon polymers
A low-carbon claim needs a number and a reference. The standard method is a product carbon footprint (PCF) under ISO 14067, built on life cycle assessment (ISO 14040 and 14044).
- Define the scope. Cradle-to-gate (raw materials to factory gate) is the usual basis for comparing materials. Cradle-to-grave adds use and end of life.
- Name the reference. The material you replace, for example virgin PP, with its own value and source.
- Report biogenic carbon separately from fossil emissions, as ISO 14067 requires. Offsets are not part of a product carbon footprint.
- Screen first, then confirm. Our free carbon footprint calculator gives indicative values in minutes. Replace them with supplier or study data before you publish a figure.
What you can claim
Since 27 September 2026, Directive (EU) 2024/825 applies across the EU to environmental claims made to consumers. It bans generic claims such as “eco-friendly” that are not backed by recognized excellent environmental performance, and claims that a product has a neutral, reduced or positive climate impact because of offsetting. B2B datasheets are not directly in scope, but the claims your customers print on shelf often start from your figures.
In practice:
- Say “low carbon” with the number and the reference. For example: “1.4 kg CO₂e/kg cradle-to-gate, against 1.9 for virgin PP, per ISO 14067”.
- Say “carbon negative” only where an LCA shows it. A masterbatch with a high biogenic carbon content can reach a negative cradle-to-gate figure, but the result has to come from the study, not from the biomass content alone. More on the term in What is a carbon-negative material?
- Present carbon storage only for durable products. A compostable product returns its plant carbon to the soil when it is composted. Its benefit is plant-based rather than fossil carbon, not long-term storage.
Frequently Asked Questions
What is a low carbon polymer?
A polymer or compound whose cradle-to-gate carbon footprint, in kg CO₂e per kg, is measurably lower than the virgin fossil polymer it replaces. There is no legal definition, so the claim should state the figure, the reference material and the method (ISO 14067).
Are bioplastics always low carbon?
No. PLA (1.6 kg CO₂e/kg in screening data) sits below virgin PP (1.9), but some compostable polyesters such as PBAT (3.2) and PBS (2.9 for a partly bio-based grade, 2.3 fully bio-based) sit above it. Bio-based and compostable describe origin and end of life, not the carbon footprint.
Is PHA a low carbon polymer?
It depends on the grade. Screening values for PHA range from 1.2 to 5.5 kg CO₂e/kg, against 1.9 for virgin PP, because feedstock and fermentation energy vary so much. Grades made from waste streams with low-carbon energy sit at the low end, and compounding PHA with biomass lowers the footprint further. Ask the supplier for the product carbon footprint of the exact grade.
Is recycled plastic lower carbon than bio-based plastic?
Often, per kilogram: recycled PP screens at about 0.9 against 1.9 for virgin PP. Supply, quality and food-contact rules limit it, and it can be combined with a biomass masterbatch to lower the footprint further.
How do you prove that a polymer is low carbon?
With a product carbon footprint under ISO 14067, comparing your material with a named reference over a defined scope, usually cradle-to-gate, and reporting biogenic carbon separately. Screening tools are a starting point, not proof.
Can a polymer be carbon negative?
Cradle-to-gate, a material with a high biogenic carbon content can show a negative figure where an LCA demonstrates it. The stored carbon stays out of the atmosphere only as long as the product lasts, so the claim makes sense for durable parts, not for compostable ones.